Collecting Code Coverage
Coverage in TWD is a feedback tool, not a vanity metric. It helps you discover untested paths and missing assertions so you can strengthen your tests where it matters. The goal isn’t “100%”, it’s to reveal gaps while you develop.
Instrumenting the Vite App
To collect browser-based coverage, your app must be instrumented. Instrumentation inserts counters into your built code so the browser can record which lines/branches run. This is framework-specific; for Vite apps we recommend vite-plugin-istanbul.
Install the plugin:
npm i --save-dev vite-plugin-istanbulThen add it to your vite.config.ts:
/// <reference types="vitest" />
import path from "path"
import tailwindcss from "@tailwindcss/vite"
import { defineConfig } from 'vite'
import react from '@vitejs/plugin-react'
// add plugin for code coverage
import istanbul from 'vite-plugin-istanbul';

// https://vite.dev/config/
export default defineConfig({
  plugins: [
    react(),
    tailwindcss(),
    // configure istanbul plugin
    istanbul({
      include: 'src/**/*',
      exclude: ['node_modules', 'tests/'],
      extension: ['.ts', '.tsx'],
      requireEnv: !process.env.CI
    }),
  ],
  resolve: {
    alias: {
      "@": path.resolve(__dirname, "./src"),
    },
  },
  server: {
    watch: {
      ignored: ["**/data/data.json", "**data/routes.json"],
    },
  },
})
This plugin automatically adds coverage data to window.__coverage__. When you run tests with twd-cli, the CLI extracts and stores this data so you can generate reports.
Configure (optional)
You can configure the output folders used by the CLI in a twd.config.json file:
{
  "url": "http://localhost:5173",
  "timeout": 10000,
  "coverage": true,
  "coverageDir": "./coverage",
  "nycOutputDir": "./.nyc_output",
  "headless": true,
  "puppeteerArgs": ["--no-sandbox", "--disable-setuid-sandbox"],
  "retryCount": 2,
  "contracts": [],
  "contractReportPath": ".twd/contract-report.md"
}| Option | Type | Default | Description |
|---|---|---|---|
url | string | "http://localhost:5173" | Dev server URL to open before running tests |
timeout | number | 10000 | Milliseconds to wait for the page/sidebar |
coverage | boolean | true | Toggle code coverage collection |
coverageDir | string | "./coverage" | Output folder for coverage reports |
nycOutputDir | string | "./.nyc_output" | NYC temp folder |
headless | boolean | true | Run Chrome in headless mode |
puppeteerArgs | string[] | ["--no-sandbox", "--disable-setuid-sandbox"] | Extra arguments for Puppeteer |
retryCount | number | 2 | Number of times to attempt each test before reporting failure. Default is 2 (one normal attempt + one retry). Set to 1 to disable retries. |
contracts | object[] | [] | OpenAPI contract validation specs. See Contract Testing |
contractReportPath | string | — | Path to write a markdown report for CI/PR integration |
Updating package.json Scripts
Install a coverage reporter to transform the raw .nyc_output into reports:
npm i --save-dev nycAdd helpful scripts:
{
  "scripts": {
    // ...
    "dev": "vite",
    "dev:ci": "CI=true vite",
    "test:ci": "twd-cli run",
    "collect:coverage:html": "npx nyc report --reporter=html --report-dir=coverage",
    "collect:coverage:lcov": "npx nyc report --reporter=lcov --report-dir=coverage",
    "collect:coverage:text": "npx nyc report --reporter=text --report-dir=coverage"
  }
}
Now, run these in two terminals:
npm run dev:ciAnd in another terminal:
npm run test:ciOnce the tests complete, you can generate coverage reports in different formats:
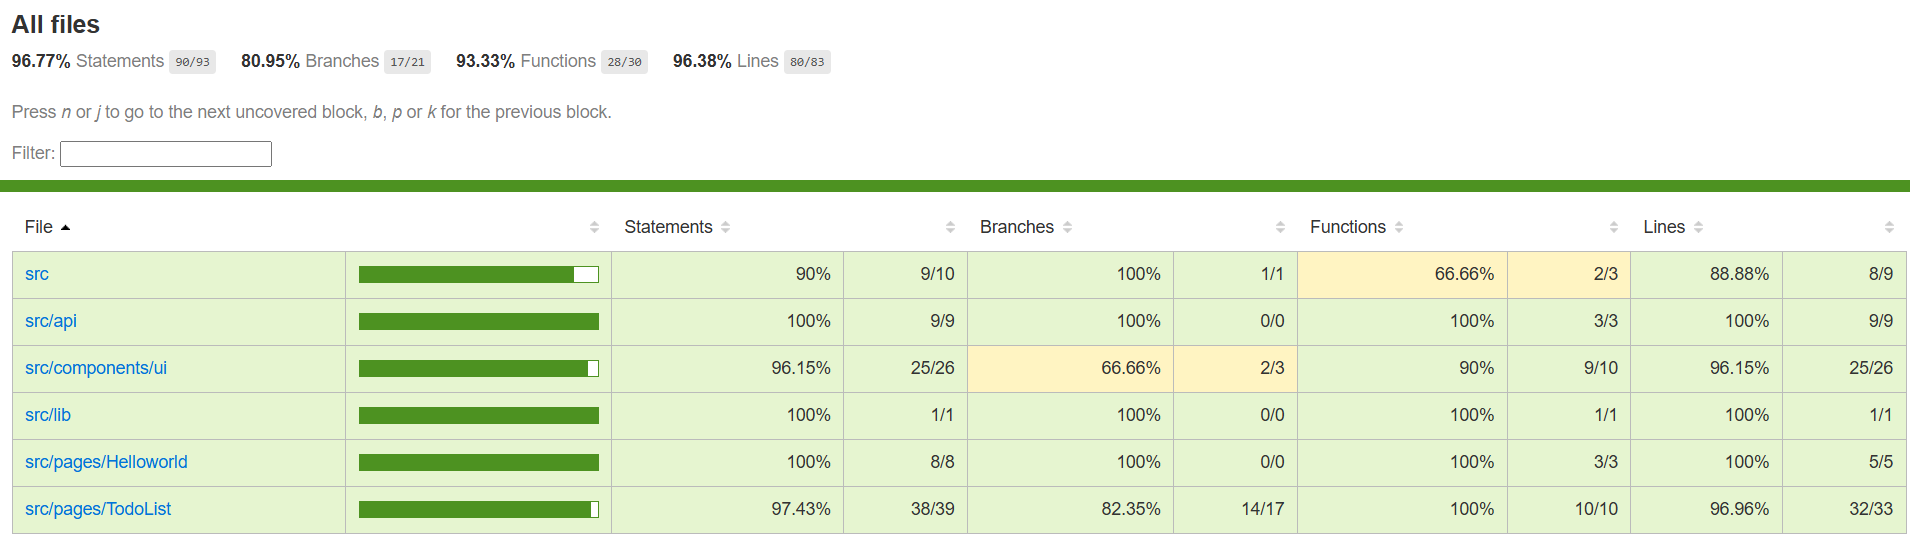
npm run collect:coverage:html
npm run collect:coverage:lcov
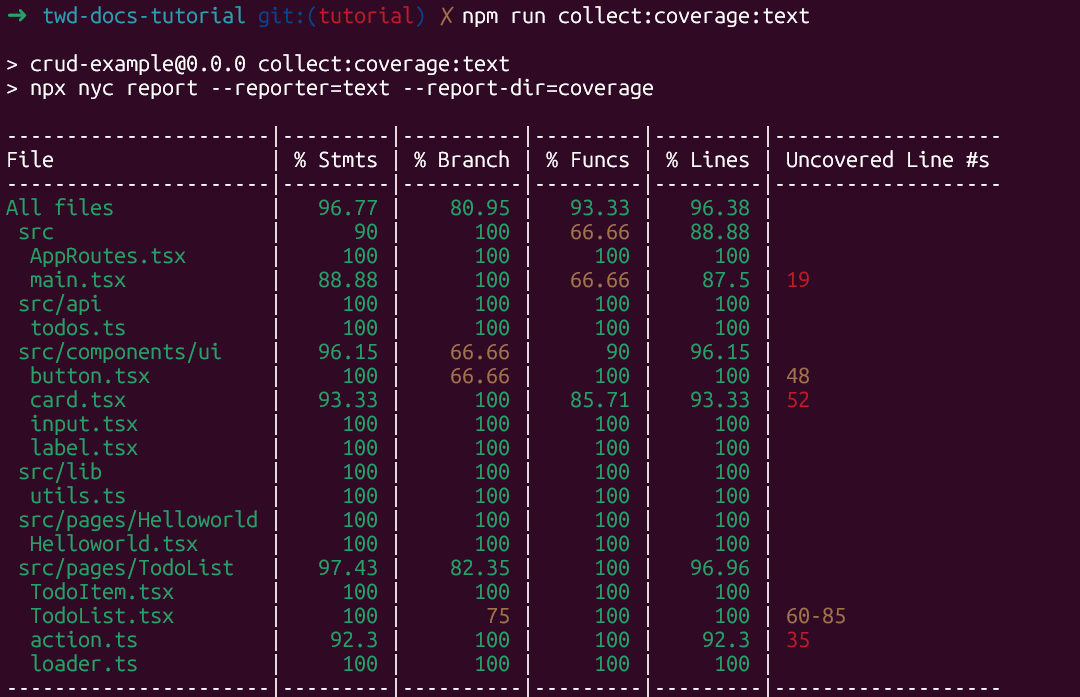
npm run collect:coverage:textYou’ll see outputs like:
Adding Coverage to GitHub Actions
Using the GitHub Action (recommended)
The composite GitHub Action handles Puppeteer setup, test execution, and optional contract reporting — so you only need to add the coverage step after it:
      - name: Start Vite dev server
        run: |
          nohup npm run dev > /dev/null 2>&1 &
          npx wait-on http://localhost:5173
        env:
          CI: true

      - name: Run TWD tests
        uses: BRIKEV/twd-cli/.github/actions/run@main

      - name: Display coverage
        run: npm run collect:coverage:text
See the CI Execution page for the full workflow.
Custom setup
If you prefer full control over each CI step, set up the workflow manually:
name: CI - twd tests
on:
push:
branches: [ main ]
pull_request:
branches: [ main ]
jobs:
test:
runs-on: ubuntu-latest
steps:
- name: Checkout repository
uses: actions/checkout@v5
- name: Setup Node.js
uses: actions/setup-node@v5
with:
node-version: 24
cache: ‘npm’
- name: Install dependencies
run: npm ci
- name: Install mock service worker
run: npx twd-js init public --save
- name: Start Vite dev server
run: |
nohup npm run dev > vite.log 2>&1 &
npx wait-on http://localhost:5173
env:
CI: true
- name: Cache Puppeteer browsers
uses: actions/cache@v4
with:
path: ~/.cache/puppeteer
key: ${{ runner.os }}-puppeteer-${{ hashFiles(‘package-lock.json’) }}
restore-keys: |
${{ runner.os }}-puppeteer-
- name: Install Chrome for Puppeteer
run: npx puppeteer browsers install chrome
- name: Run TWD tests
run: npx twd-cli run
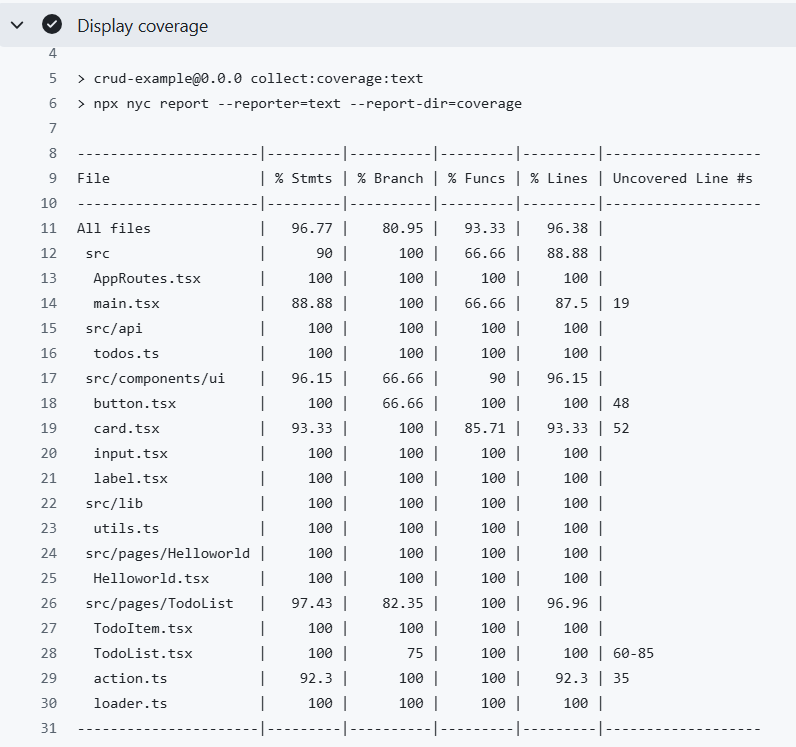
- name: Display coverage
run: |
npm run collect:coverage:textWith the Display coverage step you’ll see the coverage summary directly in your GitHub Action logs:
Having this basic configuration, it’s entirely up to you how you want to handle the coverage results. You can publish them to a service like Codecov or Coveralls, display them as badges in your README, or even use them in your CI pipeline to fail a build if coverage drops below a threshold. What matters is that TWD gives you the flexibility to collect and track coverage directly from your browser tests, without relying on a separate test runner.